Without information on the outcome of the repair, it’s hard to comment on the solution field. @neil will make that information visible, so that context becomes clearer
Chat
Linking to chat for opening in a separate tab, people are finding it frustrating having it in thread (and it doesn’t allow you to have it open in two places):
I’ve left most of the solution part blank because I had no way of knowing the outcome… perhaps somebody else can help with that, and check over my categorisations.
I’m going to have a play with visualising some of the data - working from the file devices_all.csv 
Same here, most entries do not list the solution.
Also there’s not enough info to distinguish the fault categories on a fine grain, so I end up using just Hardware and Software.
Some more specific types of unknown faults would also be useful in addition to the catchall Unknown such as Boot problem and Other power issue.
Neil has unhidden the hidden columns, should be able to see repair_status now
@Janet that’d be great to access the colour palette and any standard icons / illustrations you use for different devices etc. if that’s ok to share?
I can prepare something for that @Becky_Miller 
Will ping you when ready
Re: Updating reference data
I’m looking to update some of our reference data for laptops & desktops.
But before I get stuck in, I have a question:
Presumably for CO2 footprint, it’s useful to have figures for the latest devices on the market because we use this figure to work out how much CO2 we’d save from people not buying new stuff.
But for the weight of the device, would it not be more useful to use figures from older devices, as these are the ones we’re more likely to be fixing? Given devices tend to be getting lighter (especially laptops), using figures from the very newest machines might be unrealistic…
For now, I’ll add newer devices and keep the older ones too.
Feel free to add faults to new_fault_type column… the fault_type values in the list has come from a 3rd party report
I wonder if some of the fault types are the most useful. E.g., ‘Liquid damage - Needs new keyboard’ that fits under a ‘keyboard’ fault, however to classify the type of problems that happen, I’d find ‘liquid damage’ more useful, with keyboard replacement as a solution.
That’s an interesting question. We have a Data Quality Index (DQI) sheet at the VEEEERRY end of that spreadsheet, that explains how we score data.
On some level, it’s up to our discretion to decide how “technically representative” an LCA is. And some priority is given to the “temporal representativeness” (or “freshness”) of the data. But perhaps once we have more data about the ages of devices brought to events, this can be changed. For example, we might find that hifi components are an average of 15 years old.
Hey @Becky_Miller, here you go:
![]() Illustrations of components, devices & tools
Illustrations of components, devices & tools
And
![]() Our full branding guide is here
Our full branding guide is here
I’ll add these to Janet’s post above
Very good point - there’s limits in the current suggested list of problems for categorisation. As part of today’s work, we’re also learning about this, and will consider alternatives/better categories
@neil , it would be great to have location on the devices_all.csv
We’ve come across an interesting question: is it worth categorising solutions in case a repair was not completed? Ie. it was identified that a laptop requires replacing RAM, the solution could be “Advised”, or also “Need to replace”. Based on discussions at the event, we need to clarify what’s the purpose of categorising solutions, then decide whether to do so just for “Fixed” items, or for all.
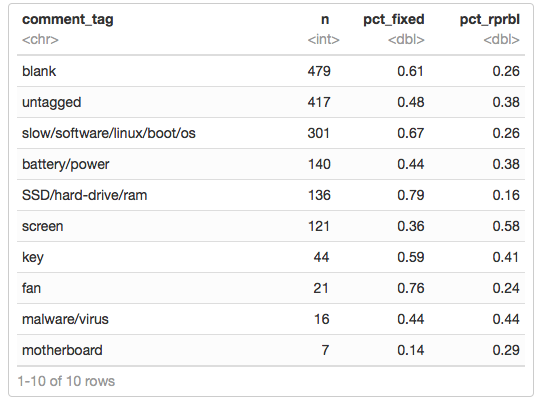
I’ve tried topic modelling and not been impressed with the results. The text comments appear to be too short for the topics to be meaningful. Instead, here’s a more basic but still automated tagging of key words for laptops:

Is this for all categories, including tablets?
I know the lack of text is frustrating, having similar problems with tablets. (I think we may need to create some kind of real-time alert to users/admins when text comments are too poor @neil @james.)
But this aggregate data is quite interesting when compared with tablets as a category, as we have proportionately more problems with screens and ports/connectors. (Perhaps ports/connectors are not picked up by this modelling?)
This causes me to wonder… are tablets are simply treated as such physically disposable products that people don’t even keep them long enough to experience “slow/software/boot” obsolescence issues.
This is just laptops, not tablets nor desktops, but I can easily re-run. On the blank entries: the sort-of-good-news is that 338 of the 479 blanks are all from one restart group.
That was one of our hypotheses - the alert would however often only work if people who were actually involved with the repair were entering the data