Hello!
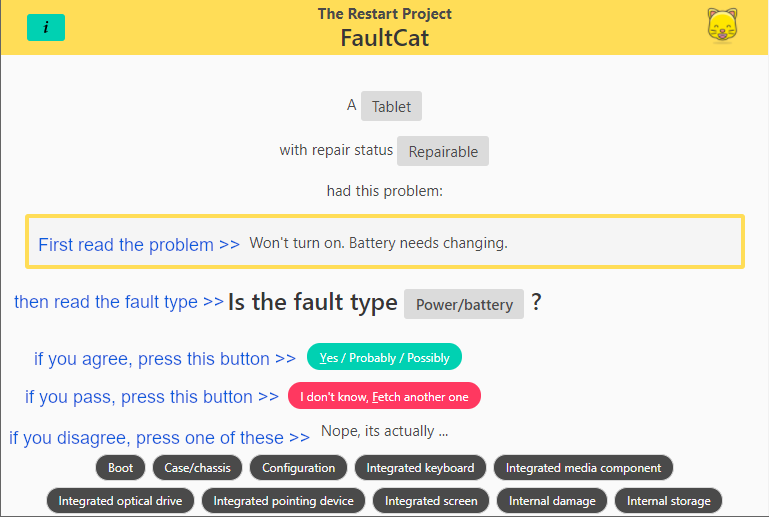
We are looking to get more people involved in improving the quality of our data so we built a little tool as an experiment in gathering opinions about the types of faults that have been recorded in the Fixometer. Its called… FaultCat Background
In 2019 The Restart Project hosted two events where participants were asked to review the problem text in records that had a “computer” category (desktop/laptop/tablet). Results and thoughts about the events were blogged.
Although the events were deemed a success and the results proved useful, we recognised that we had harvested a subjective set of opinions from people who have the time and ability to get to events.
So was born… the idea of an online “microtask” that could gather more opinions from a wider variety of people, maybe even consensus and/or debate.
Microtasking is the process of splitting a large job into small tasks that can be distributed, over the Internet, to many people.
We could use some feedback!
Have you tried it?
Does it look OK and work OK on your device?
Does the task seem inviting or boring?
Does it make you feel like giving up quickly or doing another one?
Are you interested in seeing the results and if so how should they be presented?
Have you clicked the “info” button? What would you like to see in the pop-up?
Any other thoughts about this task or microtasks/crowd-sourcing in general?
I love the idea! I blasted through about fifteen just to see what would happen (hope my feedback is helpful).
However.
It’s hard to know from the information presented, what the actual problem was… which makes it hard to know if my feedback is useful, … which discentivised me from continuing.
I haven’t been to any of the restart parties or events, sadly, so I’m not sure how the data is captured/processed but the “problem” description seems to sometimes be a description of a fault (e.g. it buzzes and won’t turn on) and sometimes a description of a fix than implies a fault (e.g. screen was replaced) or a non-fix resolution that gives no indication of the fault (e.g. laptop was reformatted for reuse), or sometimes just a description of the device (e.g. “this was a home built desktop PC diy”).
Given that huge diversity of partial information, its very hard to classify fault types (especially when the data doesn’t describe actual faults, as in some of the examples I highlighted).
So, after a short while, with 15 or so done, my feelings moved towards the ‘feel like giving up’ end of the spectrum.
I would happily help with more of this, and microtasks like it, but for it to be really effective with tangible results at the end, there may need to be some improvements to the data capture too?
Quick sense check - How much raw data is there behind this
Yep, most of the data is pretty brief, this comes from the nature of data entry which tends to be a few words on a poster-sized piece of paper using a marker pen. FaultCat omits records where the problem field is empty altogether and it fetches only “computer” repairs so there are a few thousand records that will get served up to the app.
All of the opinions will be useful, even the "Unknown"s. What we are looking to see is how the crowd-sourced opinions match up, or not, with the existing opinions that were recorded at the events. We fully expect that there will be a lot of records with unfathomable fault types given the state of the problem descriptions as they stand.
The most important thing imo is not to try to pinpoint the exact fault but rather to try to put it under an umbrella term that describes your best guess. The fault_type values don’t actually describe exact faults but rather a component or context that is related to a fault.
If the problem states only “reinstalled operating system” we have no idea what went wrong with the operating system but we can still pick “operating system” as the fault_type if its all we’ve got to go on. Likewise “performance” covers a multitude of faults, there are a lot of devices that are presented as just “slow”, again there is no way of knowing what caused the slowness but the fault, as perceived by the user, is that the machine does not perform properly.
Ideas are being investigated for improved data capture and we are in a beta trial of a spreadsheet template that includes a fault_type picklist at the point of entry.
That’s a really good point. As Monique said, all opinions are useful, but we could try to make that clearer up front, either in the help text or on page.
Surfacing specific types of data quality issues is in fact also really useful. One addition could be to have a ‘notes’ field, where you could leave info about a specific record as to why it couldn’t be classified (or any other feedback perhaps). The pro of that being you still feel you’re actively making a contribution, even if you’re having to skip a lot. One con being that it loses some of its microtasky-ness.
Great to hear! We’re already thinking of different types of microtasks that could be added - but any ideas for any in particular, please let us know.
There definitely does need to be (always bearing in mind the nature of the busy environments where the data is collected by volunteers). We’re tackling this on a few fronts (e.g. alternative capture methods as Monique mentioned). Also important is surfacing the collected data for more people to see and realise what it represents and the power it can have, and as a community see the importance of collecting it - the microtasking should help with that too
Is this particular microtask we’ve got 2021 records as of today, of devices in the desktop computer, tablet and laptop categories, entered into the Fixometer by groups using it. (There’s 2782 of those in total at present, but only 2021 with text entered). Total devices across all categories in our DB at present is 13,448. The idea would be to eventually scale citizen data microtasking to all data collected by the Open Repair Alliance, which currently could be around 30,000 and continuing to grow.
Fully agree with @Dave_Hooper’s comments as also discussed earlier with @Monique. Now for some cosmetic/UI feedback that would improve the UX for such repetitive microtasks: try to have everything fit on one page without scrolling. On a 12" screen some scrolling is required. The banner height could be reduced, probably halved, or even moved to the bottom of the page. The first three lines could be arranged as a continuous sentence which in most cases would only be one line. The green, red and nope buttons could be put on the same line.
It would be great to be able to see/read the other details that may have been captured. For example one item on FaultCat said simply “Calendar won’t sync - see above” - is that information missing from the record or are there other fields that could also be presented to the user here.
Some other suggestions:
Wouldn’t it be neat if FaultCat could display some measure of data quality for each item it presents. Some confidence measure, or even a histogram of which categories have been voted by other people. And (to incentivise people) maybe that only appears after you made your choice, as well as some nice message saying “our confidence in this entry just went up from 74% to 76.2% !” Or some such.
And then you would need to click Next Item explicitly (since right now the item gets dismissed and replaced with a a new item as soon as you choose a category)
Along those lines, it might also be good to show the current confidence/data quality even before you make your choice - maybe if confidence is already high you can just Skip And Show Me A Different One
And probably have the back end serve up more low-confidence ones more often than high-confidence ones (but still with some healthy amount of randomisation)
What you see is what you get I’m afraid, there is little else recorded that is of value to this particular task.
The data recorded by this task is not being saved back to the database immediately, it is simply written to a csv file which is emailed to me daily. At some point, when I have the time, I will import it into the database and will then be able to report some statistics. So, I’m afraid that showing any immediate results at this stage is not possible. Perhaps in the future though.
Ah but that might sway your selection! In fact I’m not sure we should even show the existing opinion… but it does make each task quicker. Also, how can we be confident that the confidence rating is accurate? What if we get someone botting or trolling the task?
The query that fetches the random records does select for those that have less than 5 opinions recorded but doesn’t compare the opinions for any kind of “confidence” rating.
One of the reasons for not saving and showing immediate results is that the data will be sanity-checked before publication. We’ll be looking for records where opinions vary wildly and/or are complete mismatches for the problem text. At least at this stage. This microtask is a prototype and we will hopefully learn a lot from this trial.
I will have a go but I am not a UX/UI expert. I use Bulma CSS framework when prototyping to avoid the pain of custom CSS and the overhead of mega frameworks like Bootstrap. If anyone out there is an expert at lightweight (no jQuery!), responsive, mobile-first layouts (that anyone can use without Sass/Gulp/npm/etc.) then please get in touch!
@Panda A new version has been deployed with some UI tweaks for tablet/laptop sized screens.
Hi @Monique that’s a super cool app, and I like the idea!
At first I did not get that I could pick up another fault type from the list below, so I did one or two without noticing.
Some of the descriptions were in Spanish and some in German, sometimes I could guess though .
It gets frustrating sometimes when there is a conclusion that seems strange, like “laptop charges but does not turn up, it needs a new charger” => euh?? I want to ask questions and discuss it But obviously a lot is going on during those repair and the thought process / diagnosis is not captured, but as discussed in previous comments there is nothing we can do if we don’t get more details anyway. That could lead to giving up.
Also the lack of feedback on this micro task, means it is not likely I’ll do more than 15, this could be game-ified one would earn stars or tools per number of answers, or display a chart with stats on the type of faults the user selected during a given session… ?
I will post up some viz on the results so far and we’re now thinking of melding this and future apps into restarters.net so that if you’re logged in it could register your contributions with a view to gamification such as leaderboard, stats, badges or such.
Good point about questions/discussions on individual repairs and faults, perhaps it could have a button to post a record in a topic here or tweet or something.
Was wondering whether in future we include a machine translation tool - but some of the text is so “informal” that it might be challenging anyways. (For example in our first data dive, I learned what “impazzito” means in Italian.)
So here is the first set of results. The column headings are explained below. The query is brand new, its all one big voyage of discovery! Click here for full view
Event Opinion : the opinion that was recorded at a Data Dive event for this record (Note that “Unknown” can also mean the record has been entered since the last event which was early September 2019)
Event Opinion Majority: Does the majority of crowd opinions agree with the event opinion for this record?
Crowd Consensus: Do all of the crowd opinions agree with each other? “-” indicates only 1 crowd opinion logged so far for this record
All Crowd Opinions Count: How many crowd opinions have been logged for this record
Top Crowd Opinion: Crowd opinion with the most “votes” for this record
Top Crowd Opinion Percentage: Crowd opinion with the most “votes” as a percentage of all crowd opinions for this record
Unique Crowd Opinions Count: Number of unique opinions logged for this record
Unique Crowd Opinions: List of of unique opinions logged for this record
Category: Product category that was recorded at the event
Problem: Defective home button - Advice given on how to source replacement home screen (4 years old)
The word “button” in the problem text above suggests a physical object and so a keyboard fault. However the category “Tablet” suggests perhaps a virtual button therefore screen fault?
One person saw “DVD” but not “driver” which makes the difference between “Configuration” and “Integrated optical drive” but would also make the difference between “Software” and “Hardware” (not that we’re collecting that with FaultCat).
My takeway from just those examples are that FaultCat could prepend the Problem text with the Category instead of it being at the top of the page, maybe even the brand/model if they are present.
Also to take a look at language detection and translation - even if its just a link to Google translate to begin with.

 .
. But obviously a lot is going on during those repair and the thought process / diagnosis is not captured, but as discussed in previous comments there is nothing we can do if we don’t get more details anyway. That could lead to giving up.