It has been wonderful to watch the ORDS dataset evolve and especially see interest in it grow. I thought it might be useful to share some info about the data and it’s journey from the repair events to publication.
Where does the data come from and in what does it look like on arrival?
The 2024-07 dataset features 1,162 unique groups contributing data across 31 countries and the problem field contains at least 12 languages.
There is no single method of data collection, as documented in Repair data collection tips and tools, nor is there a central repository. Many contributors simply send us a CSV format file, while a few have developed bespoke systems that we can tap into at will.
| Data provider | 2024-07 | % of Total | Source |
|---|---|---|---|
| anstiftung | 21,369 | 10.25% | Sent as CSV |
| Fixit Clinic | 919 | 0.44% | Google sheet download to CSV |
| Repair Café International | 75,252 | 36.09% | Repair Monitor export to Excel |
| Repair Connects | 2,885 | 1.38% | Custom API to JSON |
| The Restart Project | 72,294 | 34.67% | Fixometer SQL to CSV |
| Repair Café Denmark | 17,203 | 8.25% | Sent as CSV |
| Repair Cafe Wales | 14,292 | 6.85% | Sent as CSV |
| Repair Café Toronto | 4,277 | 2.05% | Sent as CSV |
| Total | 208,491 |
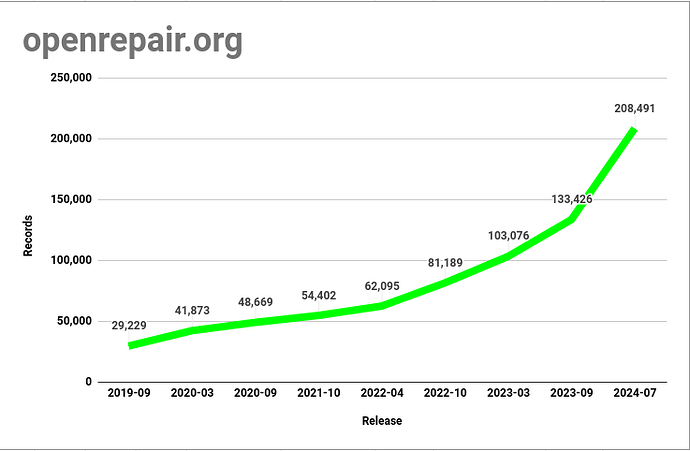
When did ORDS publication begin and how has it grown?
How is the raw data transformed to the ORDS format for publication?
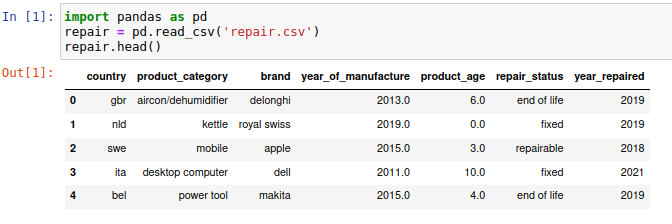
On arrival, none of the data complies with the ORDS format. For each data provider, the data is first extracted to CSV format and their columns mapped to an intermediate structure for validation using Python scripts, regular expressions and SQL queries. We are looking for things like malformed date values, GDPR issues, duplicate/test records, essential values that are missing and anomalies such as laptops manufactured in 1066. Depending on the nature of the issues detected, records might either be excluded or amended by the contributor before proceeding. Over time, exclusions have become very rare as contributors have made great efforts to improve things on their side, usually on a slim (or no) budget. Once the raw data has been validated and signed off, it is mapped to the ORDS structure, validated once more, exported for internal analysis, testing and any further fixes before final sign off and publication. I will be the first to admit that the final dataset is not perfect, the process has very much been a voyage of discovery and evolution executed on a shoestring budget.
Who uses the ORDS data?


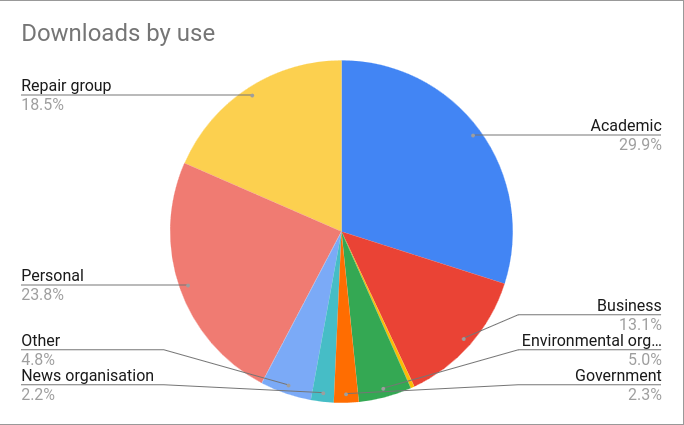
People who download the data are often kind enough to tell us who they are. Some of the more notable downloaders include:
- Amazon
- Bloomberg News
- CBS News
- Codecademy
- Defra
- Hitachi
- JRC - European Commission
- Lenovo
- Miele & Cie. KG
- Sugru
- Telegraph
- Nintendo of Europe
Sometimes they tell us what they intend to do with it, we don’t usually get to find out the results though. Recently I was lucky enough to see a draft document from Unitar that makes use of the data and mentions ORA and ORDS seven times! ![]()
What sort of things can be done with the raw data?
As well as being the person who compiles the dataset, I spend a fair bit of my spare time dabbling with it. I have a couple of public repos, the first - ORDS Tools - exists as a place to gather a bunch of code/data scraps from experiments, and as an aid for budding data wranglers - did I mention that a subset of ORDS data has long been used by Code Academy in their “Getting Started with Python for Data Science” course? ![]()

My other public repo contains some data that extends the ORDS dataset and is a result of a private repo where I explore possibilities, mainly focusing on language detection, translation, product identification and categorisation - ORDS Extra.
The data also produces some interesting poetry
Questions? Comments? ![]()
