You can view the impact your group is having from inside Restarters.net, by downloading a social-media-friendly graphic, on your group’s page on the Restart Project website, or by sharing your stats using an iFrame embed.
Viewing your impact within Restarters.net
You can see the impact your group is having on your group’s page. These statistics are automatically generated from the data you enter for each event you run and are broken down into four sections:
- Key Stats – the headline statistics of both the social and environmental impact: number of participants, hours volunteered, total events, kilograms of waste prevented and kilograms of CO2 emissions prevented.
- Events – the stats you’ve entered for each individual event (all the above plus the number of fixed, repairable and end of life devices at each).
- Environmental impact – the amount of waste and CO2 emissions diverted including comparative examples to make these easier to understand.
- Device breakdown – an overview of the most common kinds of device seen at your events as well as repair success rates.
Downloading an infographic for social media
Restarters can automatically generate a shareable infographic for social media for your group or event. This shows how much CO2e you’ve saved and compares it to the number of trees you would need to plant to achieve the same saving.
Here’s how to find it:
- find your group’s page (which will be linked to here ) or your event’s page & scroll down to the ‘Environmental impact’ section (usually about a third of the way down the page).
- click ‘Share this’ underneath the CO2 emissions prevented stat
- choose which social media platform you’d like to share the image on
- press the download button to save the image to your device
Introducing a new way to share your impact!
Then you’re ready to upload the image to a post on social media ![]()
Seeing your public statistics
Your group’s key stats and upcoming parties are also visible from your group’s page on The Restart Project’s website. Visitors can get a basic overview of your group’s impact and understand how much CO2 emission you have prevented. For an example, see Restart HQ’s page.
Embedding your group’s statistics
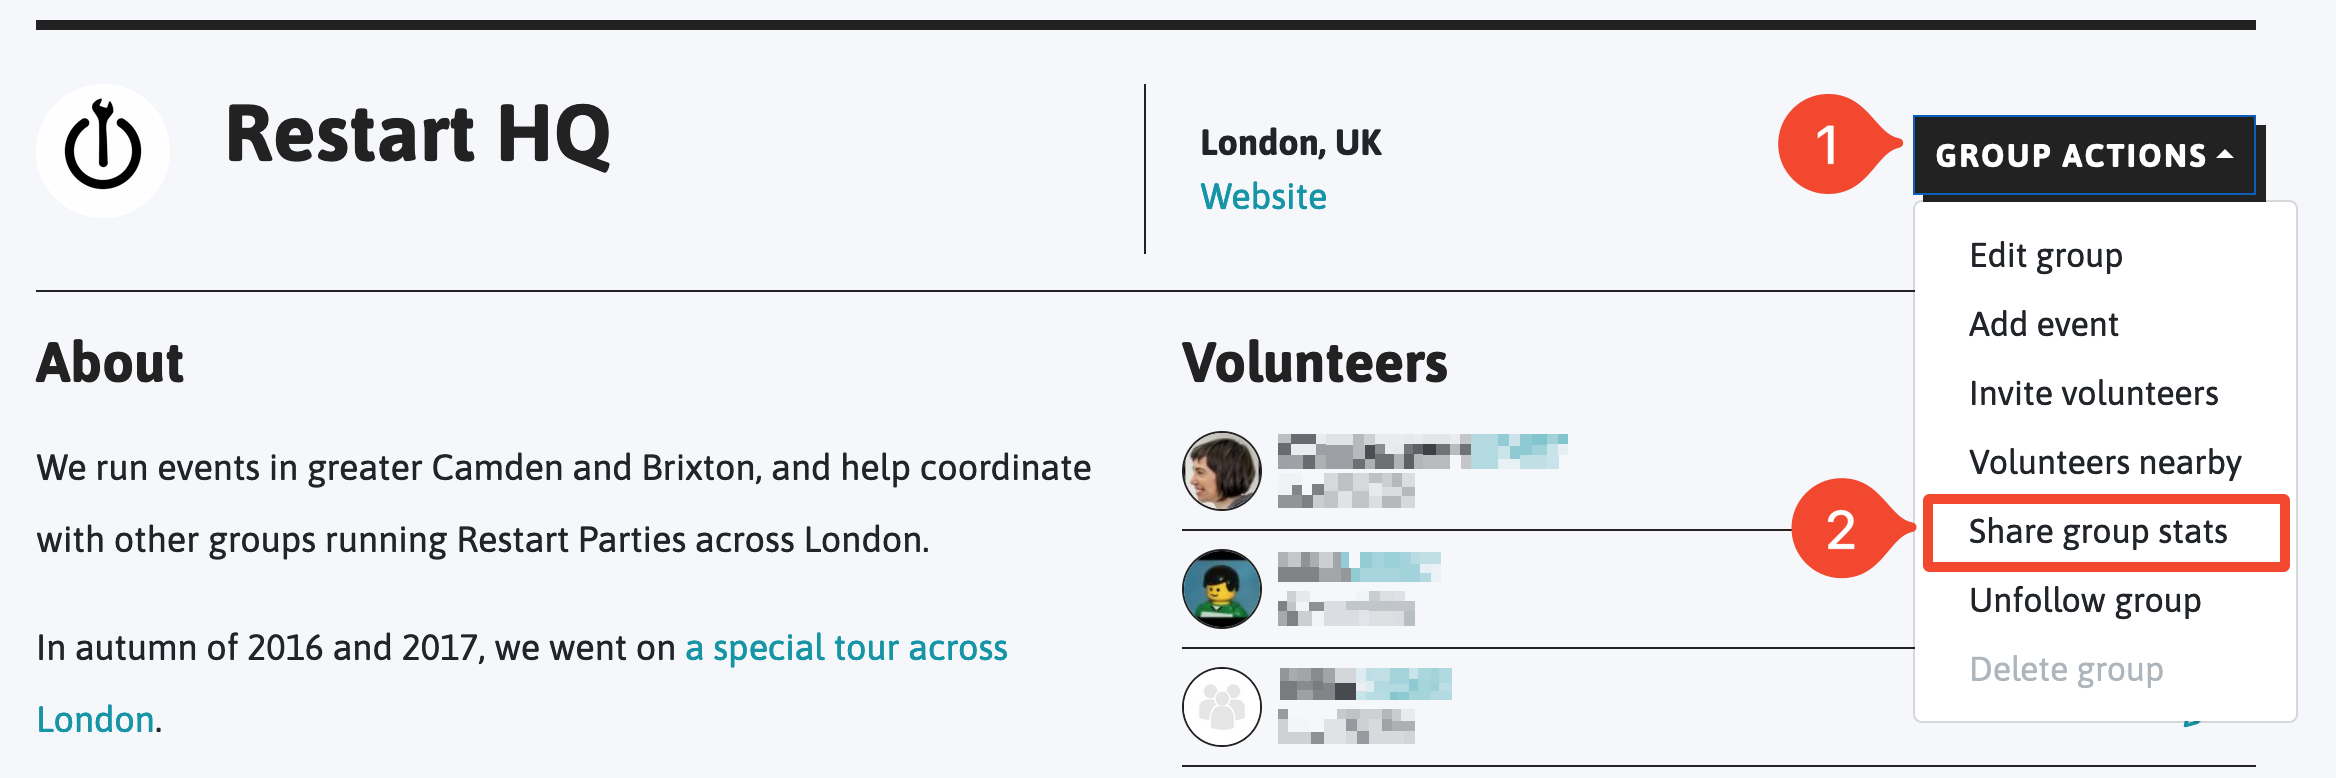
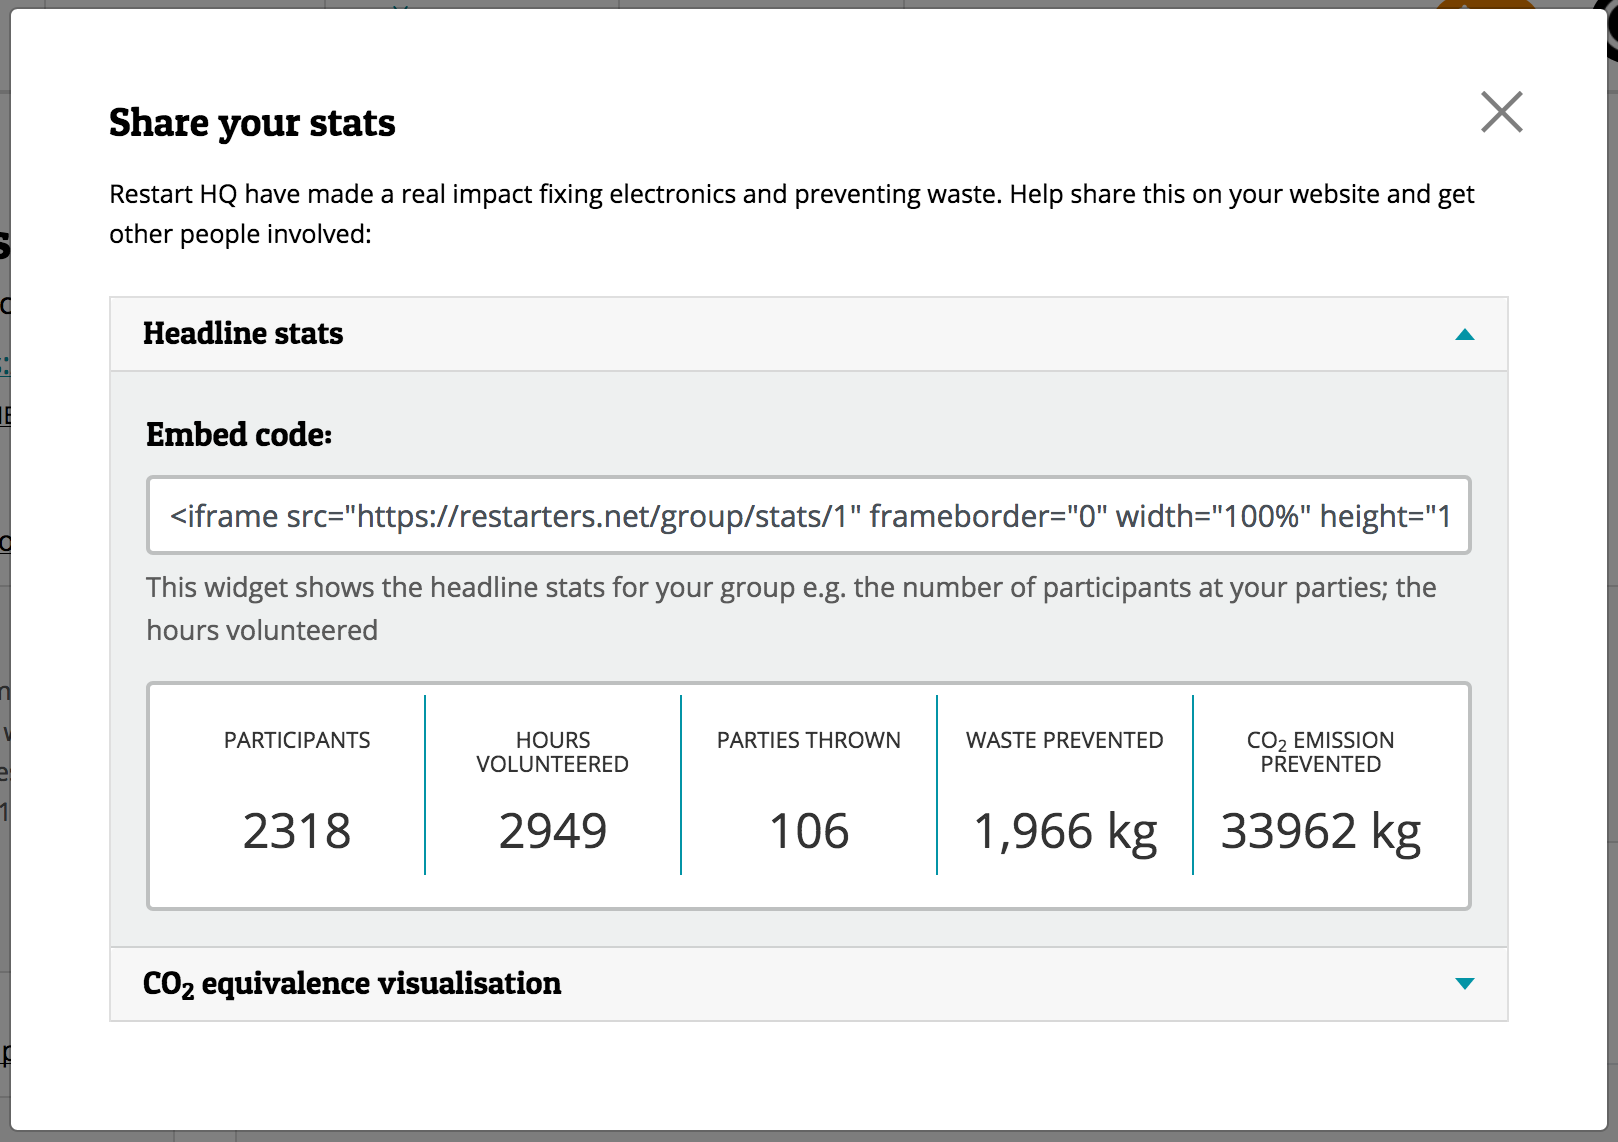
You can generate an iFrame code snippet to embed your group’s statistics on your website from the Share group stats button under the Group actions menu on your group’s page:
![]()
You can also generate code for specific parties you organised. To generate code for one of your parties, click/tap on the party you want from the your group’s page or the events page list to go to the party’s page. You will then be able to generate statistics for solely that party using the Event actions button on the right side and then clicking Share event stats .
If all else fails, you’re welcome to take a screen grab and share on your website as well.